Data Analytics is an important aspect of every organization’s record and an interesting tech path. Lets start by defining the words individually.
Data are a collection of discrete values that convey information, describing quantity, quality, fact, statistics, other basic units of meaning, or simply sequences of symbols that may be further interpreted.
Analytics is the systematic computational analysis of data or statistics. It is employed for the identification, interpretation, and sharing of important data patterns. It also involves using data patterns to make smart decisions.
Now you understand what Data and Analytics means differently, let’s understand what Data Analytics is.
The term “Data Analytics” refers to a group of quantitative and qualitative methods for drawing important conclusions from data. In order to extract numerous patterns, interactions, connections, and other significant insights from it, data science entails a number of steps, including gathering data and categorizing it.
A company can increase productivity, maximize profit, or make more strategically sound decisions with the use of data analytics.
One of the most in-demand skills globally is data analytics. Data Analytics is important to navigate the modern world, make data-informed decisions, and be able to anticipate and respond to market trends and it is essential for everyone, not just data scientists and analysts.

Importance of Data Analytics
Once an organization adopts data analytics, it may utilize the data to examine the causes of specific occurrences, understand the goals and policies of the company, and gain technical insights into the company using simple language. Here are few reasons why companies ought to use data analysis technologies and methods.
-
Target Accuracy
Using data analytics, businesses may identify the types of advertising that effectively reach and affect their target audiences. With the help of data, businesses can determine what kinds of advertising are most effective in reaching their target market and how much of that advertising they should use.
-
Demographics
It’s also crucial to collect information about the people and locations that purchase things. They can use it to determine whether the company is targeting the appropriate target market or receiving inquiries from or sales from markets that it is unable to serve. It can signify an entry and reveal the presence of a market that the company is unaware of.
Understanding why there is a greater interest from a certain geographic zone is also made possible by the analysis of data pertaining to a company’s demographic reach.
-
Bounce Rates
The bounce rate of a website is the piece of information that affects any online business. Lower bounce rates suggest that clients are genuinely interested in the company and want to learn more about its services. Higher bounce rates, on the other hand, are an obvious clue that something has been missed. It implies that the business website is not being recognized by Google or any other search engines as relevant.
A company may have a highly profitable product with widespread use. However, a high bounce rate on a business website indicates that the content needs to be reviewed immediately. It is vital to review the information offered about the company and its services.
-
New Trends
It gives companies a general concept of the patterns in customer behaviour that will propel them to the top of their respective industries through the development of innovative products and services. These innovations help companies keep a competitive edge over their rivals. The benefit of these ideas is that firms may patent them, capitalize on them, and earn better.
-
Monitoring Cost Operations
If the management is interested in running the company smoothly and productively, it would be very beneficial. A sound system will enable management to identify the business areas that are excessively draining resources and those that require more funding.

Types of data analytics
There are four (4) types of Data analytics, these includes;
- Descriptive analytics: In descriptive analytics, you base your work on the data that comes in, use analytics to mine it, and then develop a description based on the data.
- Predictive analytics: Predictive analytics makes sure that the future course of action’s path is forecasted.
- Diagnostic analytics: This entails investigating the past to ascertain the reasons why a specific event occurred. Working on a dashboard is typically central to this kind of analytics.
- Prescriptive analytics: This sort of analytics discusses an analysis based on rules and suggestions in order to prescribe a particular analytical course for the company.
Tools used for Data Analytics
The following list of analytical courses can help you advance your career in data analytics:
- Apache Spark: A real-time data analytics framework, Spark is a component of the Hadoop ecosystem.
- Python: One of the most adaptable programming languages, it is being used more and more in machine learning applications.
- SAS: SAS is a sophisticated analytical tool used for working with enormous volumes of data and gaining insightful conclusions from them.
- Hadoop: The most widely used big data framework for making sense of large data is being used by the broadest spectrum of companies worldwide.
- SQL: Relational database management systems (RDBMS) can be utilized using the structured query language (SQL).
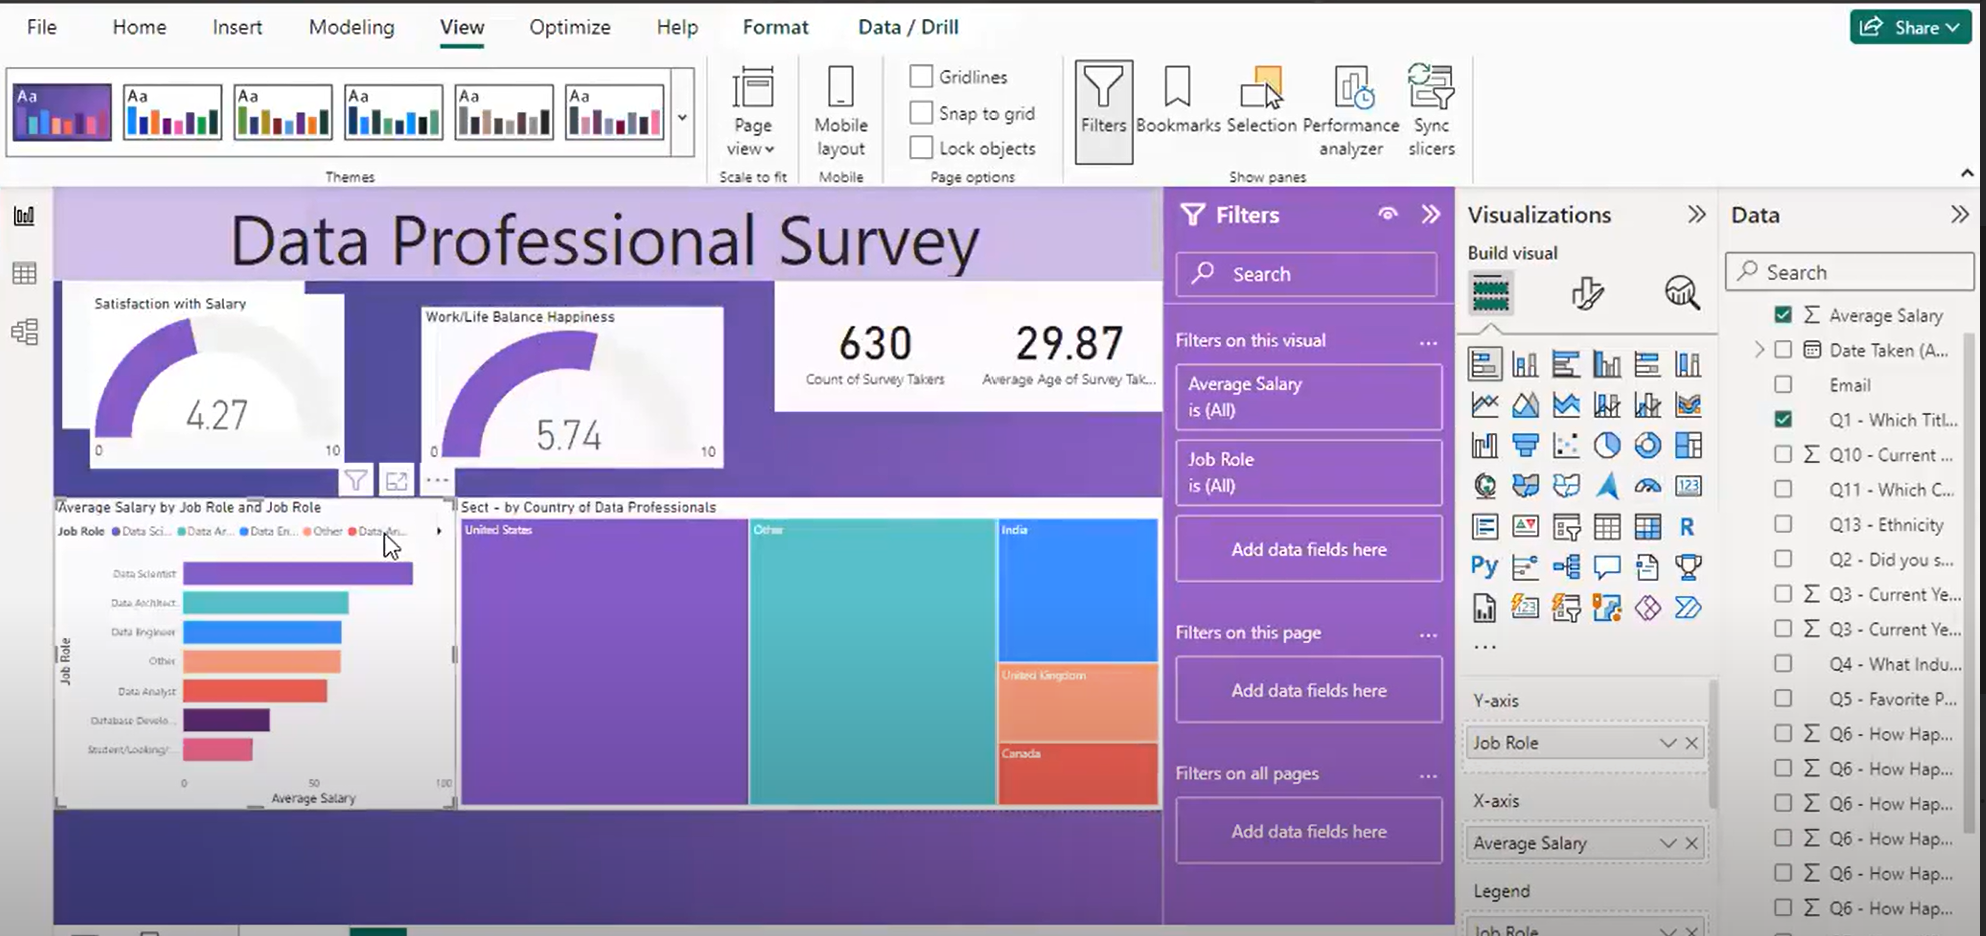
- Tableau: Used for data visualization, Tableau is one of the most widely used Business analytics and data visualization products.
- Splunk: Splunk is the preferred tool for analyzing machine-generated data and gaining insightful business knowledge from it.
- R programming: Data scientists frequently choose it as their favourite programming language. Both statistical computation and graphical applications employ R programming.

Roles of Data Analytics
Depending on the sort of company and how much it has incorporated data-driven decision-making processes, a data analyst’s job may vary. A data analyst’s duties frequently involve the following:
- Producing the necessary documentation to enable the organization’s stakeholders to comprehend the processes of the data analysis process and repeat the analysis as necessary.
- Showcasing the importance of their work in light of regional, societal, and global trends that have an impact on their organization and sector.
- Creating executive reports that use their pertinent data to clearly illustrate trends, patterns, and projections.
- Working together with programmers, engineers, and organization leaders to find ways to enhance the procedure, suggest system changes, and create data governance policies.
- Creating and managing databases and data systems, which includes repairing coding errors and other issues involving data.
- Reorganizing data-related issues after mining data from various sources.
- Data sets can be interpreted statistically, and efforts in diagnostic and predictive analytics may benefit from paying close attention to trends and patterns.
In our next blog post, I’ll be discussing the applications of Data Analytics and how you can become a data analyst in 2022.
I hope this was helpful to you. Keep reading Tech Skills Hack blog posts and send in your feedbacks.


